Chart / diagramm in englisch beschreiben?
War die letzten 2 std leider krank und muss einen chart in englisch beschreiben ._. kann mir evtl jemand helfen?
2 Antworten
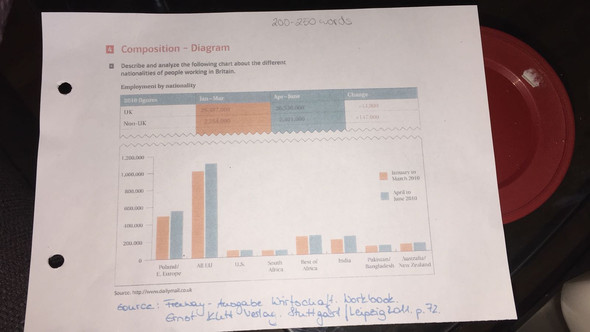
This graph shows the different nationalities of people working in Britain from January to March and from April to June in 2010. There's a total of over one million people from all over Europe working in Britain in both time measures. The second most people working in Britain are from Poland or Eastern Europe and make up almost 600,000 workers in June. People from Africa (not including South Africa) and India both make up about 200,000 workers in both time periods.
so rest kannste selber machen :D
Dann fang mal an.
Deine überstandene Krankheit hat nichts mit deiner Fähigkeit zu tun, das Diagramm zu beschreiben.
Was ist auf dem Schaubild zu sehen?
Anschließend helfen wir dir gern weiter.
danke.. hab mal bisschen drauf los geschrieben & komme niemals auf 200 wörter ._.